
Overview
Entities within Queensland's education sector help individuals transition through all stages of their schooling, giving them knowledge and skills they need for future education, training, or the workforce.
Tabled 10 June 2025.

Report on a page
This report summarises the results of our audits of the entities in Queensland’s education sector. These include the Department of Education; the Department of Trade, Employment and Training; TAFE Queensland; 7 universities; 8 grammar schools; and other statutory bodies.
The sector’s financial statements are reliable
The financial statements of the education entities are reliable and comply with relevant reporting requirements. All education entities met the legislative deadlines for signing their financial statements.
Security issues with information systems are increasing
This year, we identified more weaknesses in the entities’ information systems than last year, mainly because we tested more systems and identified similar issues across multiple systems. The majority related to how the entities manage, secure, and restrict access to their systems. We also found that entities had not addressed the root causes of deficiencies from prior years. While they are taking steps to address the weaknesses, the ongoing security issues continue to expose them to cyber attacks.
Universities’ financial performance has improved
All universities, except one, made a surplus this year. The universities’ operating results increased by $477.4 million because of higher Australian Government funding relating to domestic students, a continued recovery in revenue from international students, and higher revenue from their investments. Their costs continue to escalate, primarily due to increased wages, but at a slower rate than last year.
Universities continue to manage their financial performance. The growth in international enrolments may be affected by the changes to visa requirements the Australian Government introduced in December 2024. Domestic enrolments increased slightly in 2024 but universities face increased competition for these students. Investment returns can fluctuate from year to year depending on market conditions.
Wage underpayments for universities remain a risk
All universities are continuing to assess the extent of any historical underpayments of staff wages and taking steps to address the issues they identify. It remains a risk that has significantly affected the Australian university sector and is one of the areas being assessed through an ongoing Senate inquiry.
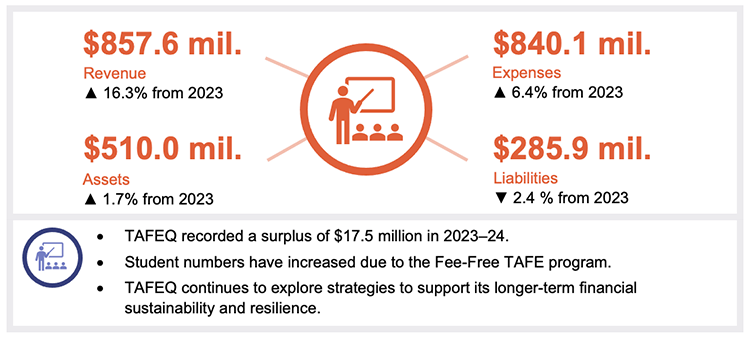
TAFE Queensland’s operating results have improved
TAFE Queensland made a surplus of $17.5 million in 2023–24, its first since the 2020–21 financial year. This was due to additional funding for the Fee-Free TAFE program and other subsidised programs.
Departments continue to underspend their capital budget
Both departments continued to face challenges in achieving their capital expenditure targets in 2023–24. Their actual expenditure, averaged over both departments’ figures, was 27.5 per cent less than planned. Shortages in materials and labour, along with adverse weather conditions, affected the timing of work and caused delays in some projects. This can mean assets may not be replaced when required and could end up costing more when the work is eventually completed.
1. Recommendations
We have not made any new recommendations to education entities this year. Instead, we are drawing their attention to recommendations from previous years that require further action.
Education entities need to take further action on prior year recommendations
This year, we identified deficiencies in the entities’ internal controls related to information security, employee expenses, and asset management.
We have identified many of these issues in reports from previous years – in some cases going back at least 4 years, as shown in the table below.
| Theme | Summary of recommendation | Education report |
|---|---|---|
| Information systems | Strengthen information and cyber security controls by reviewing access, monitoring activity, and strengthening password controls, particularly for third-party users. (Chapter 3 in this year’s report) | Report 13: 2023–24 |
| Strengthen the security of information systems by assigning only the minimum level of access, monitoring the activities of users with privileged (unrestricted) access, and implementing strong password controls and multi-factor authentication (including, for example, a code sent to a phone). (Chapter 3 in this year’s report) | Report 18: 2020–21 | |
| Employee expenses | Address the risk of wage underpayments by assessing historical pay practices, reviewing employment contracts and enterprise agreements, training staff, and evaluating payroll and timekeeping systems to enable accurate and thorough record-keeping practices. (Chapter 4 of this year’s report) | Report 13: 2023–24 |
| Asset management | Assess the condition of buildings regularly and use the information from these assessments to inform maintenance budgets and long-term asset management strategies. (Chapter 5 of this year’s report) | Report 19: 2021–22 |
TAFE Queensland also needs to take further action on our recommendation from Report 19: 2021–22. This was to develop its understanding of the value and costs of its services, use this to make decisions about its activities, and implement strategies to support its sustainability.
We have included a full list of prior year recommendations and their status in Appendix D.
Reference to comments
In accordance with s.64 of the Auditor-General Act 2009, we provided a copy of this report to relevant entities. In reaching our conclusions, we considered their views and represented them to the extent we deemed relevant and warranted. Any formal responses from the entities are at Appendix A.
2. Entities in this report
This report summarises the financial audit results for education sector entities as at their year-end dates for preparing financial statements. For the Department of Education (DoE); the Department of Trade, Employment and Training (DTET); TAFE Queensland (TAFEQ); and some statutory bodies, this was 30 June 2024. For universities, grammar schools, and other statutory bodies, it was 31 December 2024.
DTET has recently gone through 2 name and function changes – in December 2023 and November 2024. While it was known as the Department of Employment, Small Business and Training for most of 2024, we refer to it by its current name in this report.
We provide 36 opinions for this sector. Our analysis in this report focuses on the 18 entities highlighted in green in Figure 2A, representing 99.2 per cent of the revenue within the education sector.
Queensland Audit Office.
3. Results of our audits
This chapter provides an overview of our audit opinions for entities in the education sector. It also provides conclusions on the effectiveness of the systems and processes (internal controls) the entities use to prepare financial statements.
When we identify weaknesses in the controls, we categorise them as either deficiencies (those of lower risk that can be corrected over time) or significant deficiencies (those of higher risk that require immediate action by management). We report any deficiencies in the design or operation of the internal controls to management for action.
Chapter snapshot
Audit opinion results
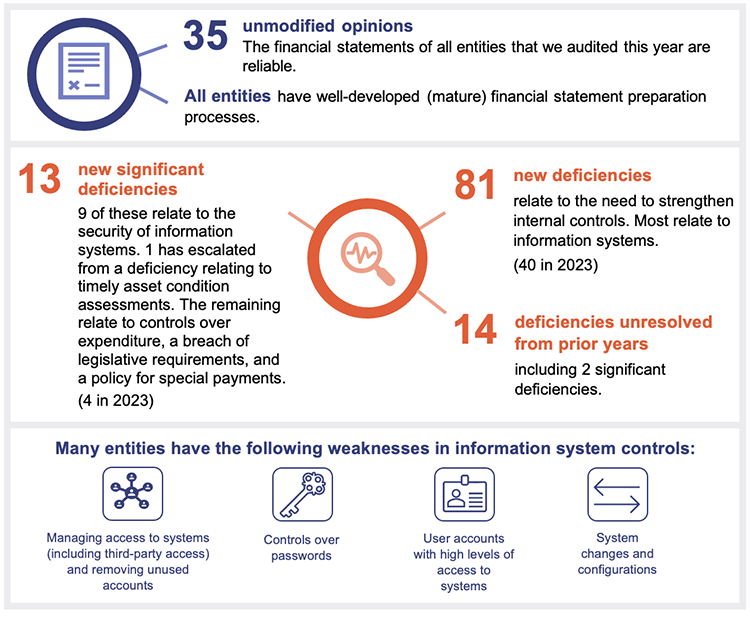
We issued unmodified audit opinions for all education entities in Queensland. This means the results in their financial statements can be relied upon. We issued an unmodified audit opinion with an emphasis of matter for 3 entities.
All entities reported their results within their legislative deadlines. Appendix E provides details of the audit opinions we issued for education sector entities in the 2024 financial year.
We express an unmodified opinion when financial statements are prepared in accordance with the relevant legislative requirements and Australian accounting standards.
We include an emphasis of matter to highlight an issue of which the auditor believes the users of the financial statements need to be aware. The inclusion of an emphasis of matter paragraph does not change the audit opinion.
Entities not preparing financial statements
Not all Queensland public sector education entities produce financial statements. Appendix F provides the full list of entities not preparing financial statements, and the reasons.
Internal controls are generally effective, but entities must address security issues with their information systems
Section snapshot 3.1
The number of deficiencies has increased
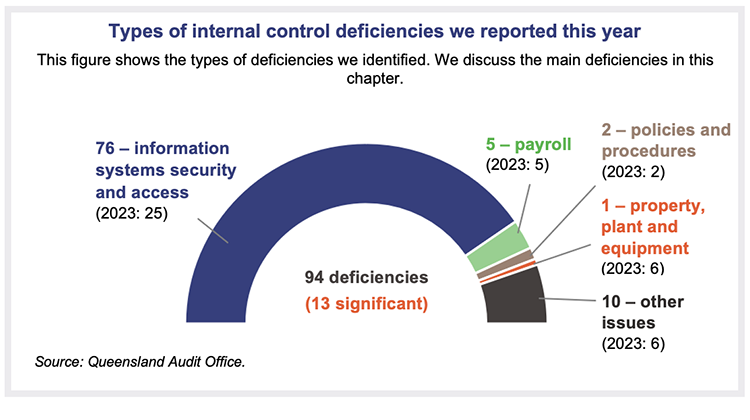
Overall, we found the education entities’ internal controls are generally effective but need further improvement. We identified 94 control deficiencies this year (2023: 44). Of these, 81 per cent (2023: 60 per cent) were related to weaknesses in the security of information systems.
By ‘information systems’, we mean the hardware, software (applications), networks, and data that entities use to manage information. They include systems for finance, student management, customer service, and asset management.
Systems are growing in complexity, and entities are increasingly using the cloud to access computing services through the internet. They are also now more reliant on automated controls (which run without human involvement), and they face increasing cyber threats.
The number of information system deficiencies increased this year due to:
- the fact that we expanded our scope to respond to the growing complexity of systems and cyber security risks. This meant we tested more information systems than we have in the past. We found the same types of deficiencies arising across multiple systems
- entities not analysing the root cause of issues we have identified in the past. They need to do this to prevent similar issues from arising in other systems, and to ensure system controls operate effectively.
It is critical that education entities address these deficiencies to improve the security of their information systems. However, we were able to rely on the systems and processes they used to prepare financial statements.
The education entities continue to work on resolving control deficiencies from previous years. At present, 2 significant deficiencies and 12 deficiencies remain outstanding. Entities expect to resolve these within the next 12 months.
The number of significant deficiencies increased this year
This year, we reported 13 new significant deficiencies (2023: 4). They relate to:
- weaknesses in information system controls at several education entities regarding
- privileged users and service accounts (4 matters reported). Privileged users have unrestricted access to make changes to the system, while service accounts perform system-related tasks that do not require human intervention
- passwords and multi-factor authentication (3 matters reported). Multi-factor authentication requires several steps to access accounts – for example, a username and password, plus a code sent to a mobile
- user access and dormant accounts (2 matters reported). User access controls determine who can access which parts of the system. Dormant accounts are unused accounts that have been inactive for a prolonged period
- a department not assessing the condition of assets in a timely manner (discussed further in Chapter 5). This matter was initially raised as a deficiency in 2021–22 and we have escalated it to a significant deficiency due to the time the department has taken to resolve it
- a university not having a policy for special payments (those that are not covered by contracts or entitlements) and those charged with governance not monitoring the special payments that were made during the year. In State entities 2024 (Report 11: 2024–25), we recommended that entities implement robust policies and procedures for special payments to ensure they are appropriate, defensible, and transparent. We encourage education entities to consider this recommendation
- a university not setting appropriate authorisation limits for payments in the finance system. (A number of staff had higher limits than their delegations allowed). This resulted in staff approving payments (totalling $13.8 million) that exceeded their delegations
- a university not notifying the Auditor-General of a change in firm to audit its foreign-based controlled entity, resulting in a breach of the Auditor-General Act 2009.
Entities need to proactively identify and address security weaknesses in their information systems
The Annual Cyber Threat Report 2023–24 from the Australian Cyber Security Centre again identified education as one of the 5 sectors most vulnerable to cyber security incidents. This is an issue for education entities due to the nature of the information they hold. They must continually assess their cyber risk vulnerabilities and exposures. Those charged with governance need to oversee this and receive regular, appropriate reports.
Education entities have taken steps in recent years to strengthen their information systems, but we continue to find weaknesses as we audit more of their systems, databases, and networks.
This year, we identified 76 control deficiencies related to information systems, including 9 significant deficiencies. Last year, we identified 25 control deficiencies and 2 significant deficiencies. This is mainly because we have expanded our audits to consider not just the applications education entities use, but also their underlying infrastructure, such as their network access for both on-premise and cloud-based computing environments.
All entities where we identified significant deficiencies either addressed them immediately or have an action plan in place to address our recommendations.
Queensland Audit Office.
Strong controls over user access can help reduce unauthorised access and cyber threats
User access controls are security measures that determine who can view or use specific resources in an information system, based on their roles and authorisation. They are designed to protect the integrity and confidentiality of information and to guard against fraud, by ensuring only authorised users can perform actions.
We found many entities have processes in place to approve or modify the access of new and existing users. But further improvements can be made.
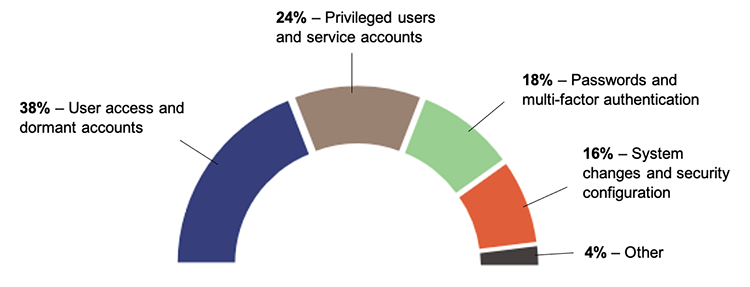
Of the deficiencies we reported regarding information systems, 29 (38 per cent) related to how entities manage user access, including 2 significant deficiencies. We found that some entities have:
- not performed regular reviews of user access to confirm that users are still working for the entity and that their access is in line with their roles and responsibilities
- no documentation outlining how access to the information system is controlled
- not removed system access for terminated users in a timely manner
- not completely removed all system access or devices that enable access for terminated users
- not performed regular reviews to disable dormant (unused) accounts and temporary access by guest users (for example, business partners, vendors, and other third parties) that is no longer needed.
Entities must effectively control their privileged accounts
The Australian Cyber Security Centre found that restricting the number of accounts with privileged access is one of the mitigation strategies in ensuring the security of systems. Malicious actors attempting to breach systems will often target accounts with these privileges because they can make significant changes to system configurations, bypass security settings, and access sensitive data.
Privileged accounts have full system access or additional special access that is not usually given to standard accounts. The additional access includes the ability to, for example:
- change security configurations
- grant or change access for other users
- remove logging (recording) information
- access all data in the system (including sensitive data).
Not all privileged accounts are for humans. Some are system/service (non-human) accounts.
Entities are becoming more aware of the risks of not effectively managing privileged access within their information systems. However, they still need to have adequate mitigating controls and robust processes to manage these risks.
Of the deficiencies we reported regarding information systems, 18 (24 per cent) related to how entities manage privileged access, including 4 significant deficiencies. We found that some entities have:
- not regularly assessed and validated whether their assignment of privileged access to users is in line with the users’ roles and responsibilities (for example, they may have more access than they need)
- a higher number of users with privileged access than the Australian Cyber Security Centre and software vendors recommend
- not monitored the activities of users with privileged access to their information systems
- assigned service (non-human) accounts with a higher level of privileged access than they need.
Strong passwords and multiple layers of security can help prevent unauthorised access
Entities need to ensure their users have strong, complex passwords that are regularly updated. They should also use multi-factor authentication to add an extra layer of security to their systems. This means users must complete a second layer of verification (such as providing a code from their phone) to gain access to a system. Even if their password is stolen, this extra step can prevent unauthorised access.
Of the deficiencies we reported regarding information systems, 14 (18 per cent) related to password and security settings, including 3 significant deficiencies. We found that some entities have:
- not implemented strong password configuration for their systems and accounts in line with their own security policies or industry recommendations
- not enabled multi-factor authentication for certain user accounts.
Recommendations for entities
Recent cyber security incidents have shown the types of weaknesses noted above can lead to compromised systems.
Our previous recommendations relating to strengthening the security of education entities’ information systems remain relevant. (Appendix D provides the full recommendations and their status.)
It is important that entities apply the appropriate security principles and recommendations to all systems they use to ensure all their information systems are properly secured.

| Entities need ongoing effort to effectively manage cyber risks It is essential that entities continuously manage cyber risks. We encourage them to regularly self-assess the strengths of their information systems against the recommendations we made to all entities in:
|
As identified in our Forward work plan 2024–27, we intend to undertake an audit on managing third‑party cyber security risks in 2025–26. It will examine how effectively the Queensland Government identifies third parties with access to its data and networks, assesses related security vulnerabilities, establishes relevant controls, and minimises the impact of security breaches through these third parties.
Entities need to improve their payroll processes
We continue to identify deficiencies in payroll processes at education entities, and we raised 5 deficiencies this year (2023: 5). They related to breakdowns in controls for ensuring entities:
- prepare and review payroll reconciliations in a timely manner and make sure appropriate (and different) staff perform each of these tasks, to reduce the risk of errors
- have an appropriate timesheet system and regularly review time recording by casual staff
- require casual staff to complete and submit timesheets in a timely manner, and have appropriate monitoring and reporting.
In last year’s report, we identified a significant deficiency at a university that had ineffective controls for reviewing how it integrated payroll processing between 2 separate payroll systems. The university has resolved most of our recommendations and was introducing a new workforce management system and making updates to its existing payroll system by the time we completed this audit.
Universities need to take further action on controls over timesheets for casual staff
Universities employ a significant number of casual staff, especially in academic positions such as lecturers, tutors, and researchers.
We found casual staff at 2 universities were accumulating timesheets for multiple pay periods and submitting these in bulk for approval (also known as timesheet banking). In some instances, the hours being claimed in 2024 related to work performed as far back as November 2022. We have identified similar issues at other universities in previous years.
This limits the effectiveness of the timesheet approval process. It increases the risk of casual staff not being paid correctly and makes it difficult to verify the hours worked. It may also result in a breach of enterprise agreement requirements. In Education 2023 (Report 13: 2023–24), we highlighted the risk for universities regarding historical underpayments of staff wages and entitlements.
Those universities that we made specific recommendations to in our audits are in the process of acting on them.
4. Financial performance and sustainability
In this chapter, we analyse the financial performance and position of education entities.
We focus on major issues that arose this year. We specifically examine the financial performance of the universities and TAFEQ, and then movements in the value of the education entities’ assets.
The financial performance of universities has improved
Section snapshot 4.1
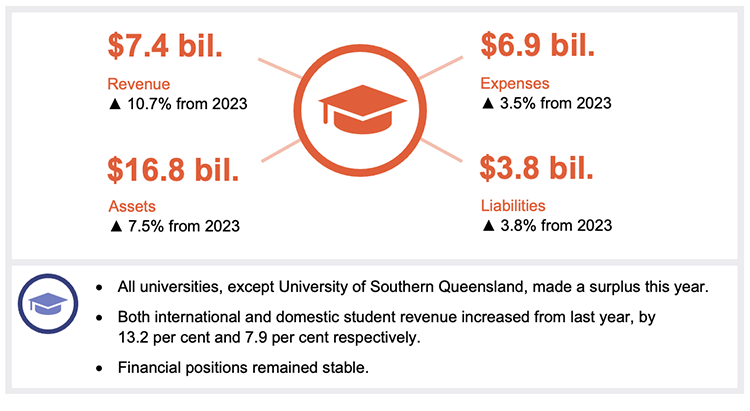
The overall operating results (revenue less expenses) of Queensland universities increased again this year, by $477.4 million (2023: $554.5 million). All universities made a profit in 2024, except for University of Southern Queensland. A continuing recovery in revenue from international students, higher Australian Government funding relating to domestic students, and higher returns on investments all contributed to this. These were, however, offset to some extent by continued cost escalations, especially for employee expenses.
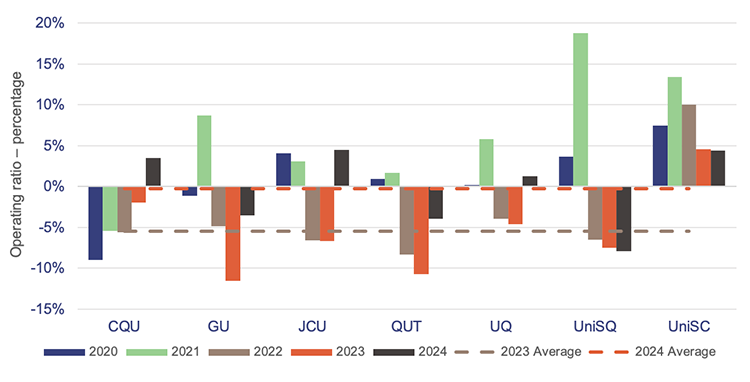
To assess the universities’ long-term financial sustainability, we calculate their operating ratios (revenue less expenses, expressed as a percentage of total revenue) as an average over time. As Figure 4A shows, the operating ratios for most universities have improved over the last 2 years.
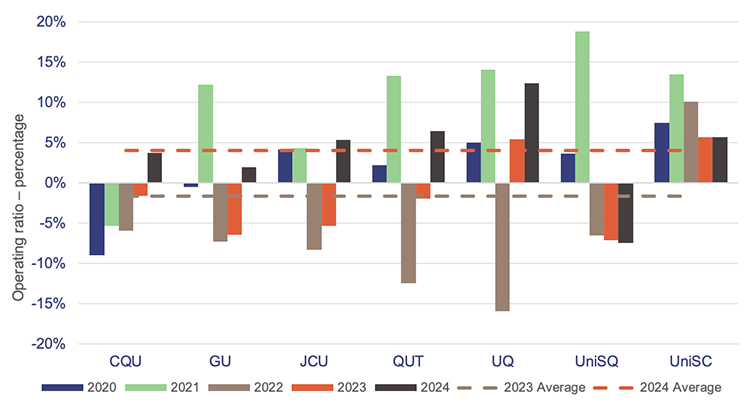
Notes: CQU – Central Queensland University; GU – Griffith University; JCU – James Cook University; QUT – Queensland University of Technology; UQ – The University of Queensland; UniSQ – University of Southern Queensland; UniSC – University of the Sunshine Coast. These ratios include controlled entities (whose finances and operations are controlled by one of the universities).
Queensland Audit Office.
This year, University of Southern Queensland recorded a deficit of $28.4 million. It saw a decline in international student enrolments compared to the other universities, which was impacted by changes in visa processing. It also incurred higher employee expenses from a restructure (redundancy program) it undertook to manage its future costs.
Central Queensland University recorded a surplus of $20.1 million in 2024 after 4 years of deficits. It has implemented strategies to reduce its costs, including an organisation restructure in 2020. The university met its expenses from its revenue in 2024. This was due to ongoing cost savings, an increase in revenue from international students, and additional funding from the Department of Trade, Employment and Training (DTET) for vocational training courses. This included the Fee-Free TAFE program, which is a joint federal and state government initiative providing free access to select vocational courses for eligible students. Central Queensland University provides TAFE courses as well as university programs.
Financial transactions and events over the last few years have affected the results of some of the universities. For example:
- In 2021, the Queensland University of Technology’s and University of Southern Queensland’s results included one-off gains following the restructure of their investment in Education Australia Limited (see later section on franking credit claims). They recorded this as revenue. Other Queensland universities recorded this as equity (assets less liabilities).
- In 2023, Griffith University’s, James Cook University’s, and The University of Queensland’s operating ratios reflected a reduction in the value of a receivable of $22.8 million from the Australian Taxation Office (ATO), which they recorded as an expense. They did this because of an ongoing dispute with the ATO (see later section on franking credit claims). Other Queensland universities continued to record it as an amount owing from the ATO.
- In 2024, James Cook University received $16.7 million in one-off capital funding from the Australian Government for the construction of the Cairns Tropical Enterprise Centre.
Revenue from international and domestic students has increased
In 2024, total revenue recorded by the university sector from international students increased by $204.7 million (13.1 per cent). Last year, this was $326.2 million – a 26.4 per cent increase.
International student enrolments have increased due to strong post-pandemic demand. However, this growth has been affected by changes that were made to visa processing in December 2023. Further changes in December 2024 may impact future international student enrolments.
Other risks such as the geopolitical environment and wars could also affect future enrolments.
In 2024, total revenue recorded by the university sector from domestic students increased by $207.6 million (7.9 per cent) (2023: decreased by $9.3 million – 0.4 per cent), due to an increase in Australian Government grants. Universities have funding guarantees regardless of domestic student enrolments from the Australian Government, but these are due to end in 2025.
There is a risk that Commonwealth Grants Scheme payments (which are linked to student enrolments) will reduce if universities do not have enough domestic students enrolled to use the full funding available.
Through the Commonwealth Grants Scheme, the Australian Government subsidises tuition costs for higher education students across a wide range of study disciplines and qualification levels.
Domestic student enrolments increased slightly by 1.3 per cent in 2024, following 2 years of decline. However, universities are still facing challenges in the domestic student market. The low unemployment rate and cost of living pressures continue to impact demand for university places as students defer study, take smaller study loads, or enrol in free vocational training.
Universities face increased competition for domestic students from both their peers and vocational educational providers, and must manage their strategies to attract and retain them effectively.
Figure 4B shows the breakdown between international and domestic revenue and the equivalent full-time student load (EFTSL) over the last 5 years.
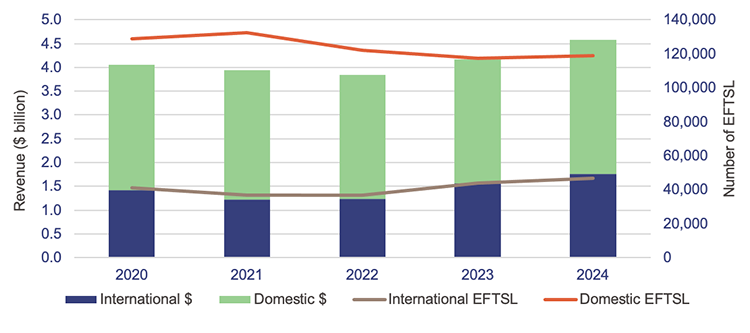
Note: Not all students study full time for a whole year. Equivalent full-time student load (EFTSL) is a way of representing the various study loads as a proportion of the study load the students would have if they were studying full time for one year. ‘Number of EFTSL’ adds them all together.
Queensland Audit Office.
Universities received higher returns on their investments this year. This is not guaranteed in future
Universities’ investments in managed funds (where monies are pooled together with that of other investors) performed strongly in 2023 and 2024, influenced by favourable market conditions and investment strategies. But this can fluctuate from year to year. In 2022, the sector recorded losses from investments because of a decline in global financial markets.
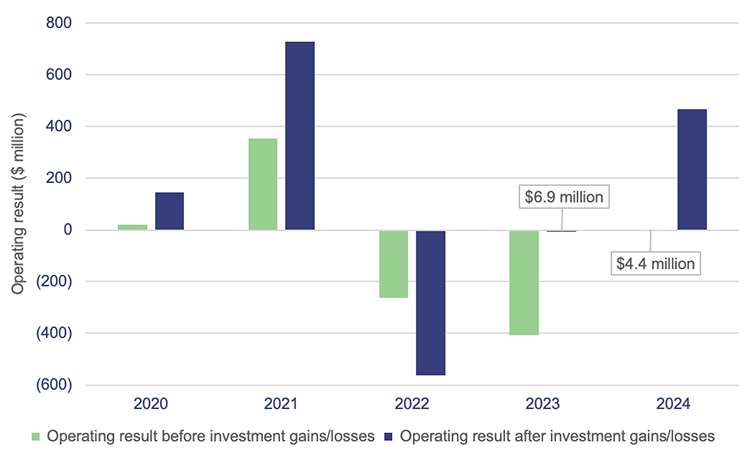
Figure 4C shows the significant impact that investment market volatility can have on universities’ operating results. In 2024, before including any gains from investments, the sector would have recorded a smaller profit of $4.4 million. In 2023, the sector would have recorded a loss of $403 million.
Queensland Audit Office.
Gains or losses from investments are changes in the value of an investment. If the value of an investment goes up, it is called a gain. If the value goes down, it is called a loss.
These changes are recorded in the university’s operating results, even if it has not sold the investment yet. This means its results can be affected by changes in the value each year.
Gains or losses will not translate into actual cash until universities receive payments (for example, dividends) from their investments or sell them.
Figure 4D shows the impact on universities’ operating ratios before gains or losses from investments. Without the gain, Griffith University and Queensland University of Technology would have incurred a loss in 2024. The University of Queensland would have reported a much lower profit this year, and a loss in 2023. These 3 universities hold larger investment portfolios than the others, and they are more affected by fluctuations in market conditions as a result.
Queensland Audit Office.
Costs have increased, but at a slower rate than last year
In 2024, total expenses recorded by the university sector increased by $237 million (3.5 per cent), a slower rate compared to the $616 million (10.2 per cent) increase in 2023. Universities are implementing various cost-saving measures to manage their expenses. These include conducting reviews of their workforce, and streamlining operations to reduce administrative costs.
The increase this year was mainly because of higher employee expenses, which continue to be the universities’ biggest cost – 56.4 per cent of total expenses. They increased by $195 million (5.3 per cent) (2023: $282 million – 8.2 per cent), mainly due to salary increases under enterprise bargaining agreements, growth in the number of employees, and redundancy payments at University of Southern Queensland.
Last year, the increase in employee expenses was at a higher rate, with some universities incurring costs to address historical wage underpayments, which contributed to the rise.
Universities continue to assess wage underpayments
The Australian university sector has been significantly affected by historical wage underpayments to staff. The Fair Work Ombudsman identified systemic failures in universities’ compliance, central oversight, and governance processes, all of which contribute to these underpayments.
An inquiry by the Senate Education and Employment Legislation Committee – established in January 2025 – is currently investigating the quality of governance at universities. One of the areas being assessed is their compliance with legislative requirements, particularly concerning workplace laws and regulations.
In Education 2023 (Report 13: 2023–24), we reported that all 7 Queensland public universities were reviewing their compliance with enterprise agreements, and some had identified wage underpayments. These totalled $29.9 million over the last 3 years. In their financial statements, they recognised this as an expense in the year it was incurred, or recorded a liability for amounts identified but not yet paid.
The Queensland universities are continuing to assess the extent of any historical underpayments of staff wages and entitlements and taking steps to address the issues they identify. These steps include repaying the affected staff, reporting to the Fair Work Ombudsman once they become aware of an issue, and, for some universities, reviewing their payroll systems to prevent future issues.
Our prior year recommendation – to assess employment agreements and historical pay practices to identify potential wage underpayments – remains relevant. Appendix D lists all of the recommendations and their status.
Universities are disputing their franking credit claims with the Australian Taxation Office
The 7 Queensland universities, along with 31 other Australian universities, owned shares in Education Australia Limited (a private company). In 2021, it went through a major restructure and paid a cash dividend, transferred a portion of its shares in IDP Education Limited (a listed company), and distributed the associated franking credits (see below) to each university.
Franking credits represent the tax a business pays on its profits. This saves its investors from having to pay tax on their share of the profits, which are known as dividends. Universities seek a refund from the Australian Taxation Office for the franking credits on their investments.
In Education 2023 (Report 13: 2023–24), we reported that all 38 Australian universities had lodged a formal objection with the Australian Taxation Office, disagreeing with its decision to decline their eligibility for a refund of their franking credits. The franking credit claim for each university was $22.8 million. For Queensland public universities, this totalled $159.6 million.
In January 2025, the Australian Taxation Office formally responded to 2 universities in other states (Federation University Australia and University of Wollongong), standing by its original decision. These 2 universities are appealing against the decision in the Federal Court of Australia. The objections for each of the other 36 universities remain on hold pending the outcome of the legal proceedings.
As with last year, the Queensland universities have used different financial reporting treatments, highlighting the uncertainty regarding this issue. Griffith University, James Cook University, and The University of Queensland have recorded an impairment expense (a reduction in the value of their claims) for the full amount while they wait for the matter to be resolved. Other Queensland universities have continued to record it as an amount owing from the Australian Taxation Office. We have again concluded we had sufficient and appropriate audit evidence to support each university’s financial reporting treatment.
TAFE Queensland’s operating results have improved
Section snapshot 4.2
TAFE Queensland (TAFEQ) is the largest public provider of vocational education and training in Queensland. It services rural and remote areas of the state and ‘thin’ training markets (where there is low demand), ensuring equitable access to all students across the state.
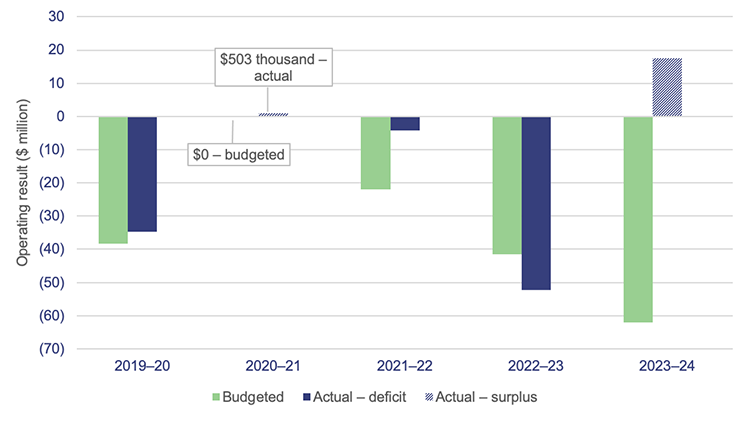
TAFEQ has experienced significant financial challenges in recent years. Figure 4E shows its operating results since 2020–21.
In 2023–24, it met its expenses from its revenue, recording a surplus of $17.5 million – its first since the 2020–21 financial year. Results this year have improved due to the impact of Fee-Free TAFE, and TAFEQ is budgeting for another surplus of $9.6 million in 2024–25. However, since Fee-Free TAFE is expected to end in 2026, it will need to continue to focus on longer-term sustainability strategies.
Queensland Audit Office.
As mentioned earlier, Fee-Free TAFE is a joint federal and state government funding initiative, providing free access to select vocational courses to eligible students. It started in January 2023, with the 2023–24 financial year being the first full year of the program.
TAFEQ received additional funding of:
- $11.8 million, directly related to additional places through the Fee-Free TAFE program
- $58.5 million from Department of Trade, Employment and Training (DTET) for other subsidised TAFE programs due to higher student enrolments.
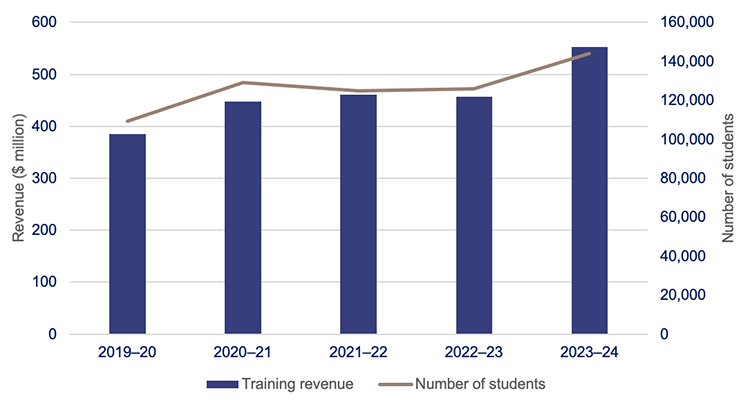
Figure 4F shows the training revenue and student enrolments over the last 5 years. It highlights the increasing student enrolments in 2023–24, largely driven by Fee-Free TAFE.
Queensland Audit Office.
Long-term strategies to become financially sustainable
TAFEQ is continuing to refine its funding model to better understand the cost and value of its activities at a product, course, and location level, including:
- developing an organisation-wide education planning tool that will enable a consistent approach to planning and enhance reporting (for example, on class sizes, teacher capacity, and productivity). This is anticipated to be fully in place by June 2026
- undertaking a medium-term project to increase the conversion rate of student enquiries to enrolments
- implementing a ‘Financial Sustainability & Resilience Plan' through which TAFEQ will review its business operations to ensure that it has a financially strong business structure.
Measuring the value of assets
Property, plant and equipment continues to be the most significant item on the balance sheet for education entities, accounting for 84.7 per cent ($48.8 billion) of their total assets.
Each year, education entities must ensure that asset values reported in their financial statements are reflective of their fair value. They measure the value of their assets in 2 ways – market value or current replacement cost.
The market value approach measures fair value based on how much a buyer would be willing to pay for the asset after considering any restrictions imposed through government regulations. This approach is used by entities for valuing land and non-specialised buildings such as residential properties.
Current replacement cost is used when there is no active market for buying and selling assets, such as specialised buildings for universities and schools. It represents how much it would cost to replace them at today’s prices.
Measuring the value of some asset categories (such as land, buildings, and infrastructure) for education entities can be complex. It requires judgement and estimates, especially when updating the fair value of the buildings. Various factors affect these updates, including construction costs and labour supply.
Figure 4G shows the percentage increase in the value of property, plant and equipment for each education entity, resulting from valuations performed in 2024.

Notes: For the government departments, the movements shown are for 2023–24. For the universities and grammar schools, they are for the 2024 calendar year.
DoE – Department of Education; DTET – Department of Trade, Employment and Training (renamed from the Department of Employment, Small Business and Training following Administrative Arrangements Order (No. 3) 2024 on 21 November 2024); Grammar schools – combined movements for all 8 grammar schools.
Queensland Audit Office.
DTET had an upward valuation movement of $407.7 million in 2024, mainly driven by the value of its buildings. It performed a full revaluation of more buildings in 2023–24 than in prior years. Also, current market conditions continue to increase construction and labour costs, resulting in higher costs to upgrade or replace buildings than in the past.
Central Queensland University, Queensland University of Technology, and University of the Sunshine Coast recorded a lower overall valuation increase in 2024 compared to other education entities. While they did record an increase in their value of buildings, this was partially offset by:
- the value of land at Central Queensland University decreasing due to restrictions on certain parcels, which were a result of how its external valuers assessed the land
- the value of land at Queensland University of Technology decreasing due to lower recent comparable sales and changes to the accounting standard for fair value of assets. These changes require land to be valued based on its current use rather than its future development potential. Other universities were not significantly affected because of where their land is located and the judgements they used in their valuations
- some buildings at University of the Sunshine Coast being reclassified out of the buildings category in its financial statements from a change in its valuation approach.
We concluded that readers can rely on the value of the property, plant and equipment reported by each entity in its financial statements.
Financial results of departments
In 2023–24, DoE and DTET (which has recently gone through 2 name and function changes) met their expenses from their revenue.
Figure 4H shows overall operating results for the year compared to the previous year, as well as the movements in net assets (assets less liabilities) in 2023–24 for both departments.
Financial results – Department of Education

| $123.0 million surplus ▼ 15.0% from 2023 Apart from an increase in depreciation expenses, the department incurred higher salaries and wages costs due to having a higher number of employees, and wage increases. Its revenue is mainly from appropriations (allocated by parliament during the budget process). The Australian Government signed an agreement with the department on 24 March 2025 that enables continued funding for schools from 2025 to 2034. |

| $34.8 billion net assets ▲ 9.2% from 2023 This was mainly due to an increase in the value of the department’s property, plant and equipment. It was driven by upward valuation movements and the investment of $1.2 billion in schools and buildings. |
Financial results – Department of Trade, Employment and Training
|
| $19.4 million surplus ▼ 55.4% from 2023 This was mainly due to a gain from the revaluation of the department’s land being included in revenue. The department also incurred higher employee expenses and operating costs, as the Youth Justice function was included for 6 months of the financial year. In addition, it faced increased expenses for depreciation and for administering grants to vocational education providers – such as for the Fee-Free TAFE program. Its revenue is mainly from appropriations. |
|
| $2.6 billion net assets ▼ 8.7% from 2023 This was mainly due to a decrease in the value of the department’s property, plant and equipment. While it recorded an upward valuation movement, this was more than offset by the transfer of property, plant and equipment of $532.1 million, for the Youth Justice function, to a new department. |
Queensland Audit Office.
Depreciation is how an entity charges part of an asset’s cost each year, based on how long it is expected to last.
5. Asset management in education entities
Assets, such as buildings, play an important role in the delivery of education services. Entities need to carefully plan to maintain, upgrade, and replace them as necessary. Asset management plans, linked to entities’ overall strategies, can help with investment decisions and ensure assets continue to be fit for purpose and respond to changing business needs. Because of the value of these assets, and the risks associated with how entities manage them, this year we have dedicated this new chapter to report on asset management.
Population growth continues to influence capital (major infrastructure) programs
The Department of Education (DoE) has invested $6.2 billion in its property, plant and equipment assets (mostly schools and buildings) in the last 5 years to ensure it is prepared for the future and for growing student numbers.
Population growth continues to affect how and where schools are being built and buildings are being replaced. The Queensland school-aged population is forecast to grow by 2.9 per cent over the next 5 years. DoE is building new schools and expanding existing schools in the areas that are expected to have significant population growth, to ensure these areas have the capacity to service their communities.
The department manages over 36,000 learning spaces and support facilities across 1,266 schools. It has built 2 new schools – as planned – for students who started in Term 1 2025, and it will open one new school in 2027 (initially planned for opening in 2026).
It is also planning to construct 8 more new schools but the opening dates have not been finalised. It had initially set opening dates for some of these schools, but enrolment demand and residential growth have stabilised in these regions, reducing the immediate need. As a result, the dates will be re-set in future.
The departments continue to experience challenges in spending their capital expenditure
The departments’ capital programs have costs allocated to specific projects and programs. In last year’s report, we stated that both departments faced challenges in achieving their capital expenditure targets. Those challenges continued in 2023–24, with DoE underspending by $364 million (22 per cent) and the Department of Trade, Employment and Training (DTET) by $26 million (33 per cent) compared to their planned programs.
Difficulty in finding workers and getting materials, along with adverse weather conditions, has caused delays in some projects and affected their timings. Once the work is eventually started, the departments risk facing higher construction costs than they initially budgeted for.
DoE plans to spend $1.2 billion in 2024–25 on large expansion programs for schools; and DTET plans to spend $80.4 million on training infrastructure and expansion projects. If they cannot achieve this, there is a risk that assets will not be delivered, upgraded, or replaced when required.
Meeting education infrastructure challenges
While the expansion of education infrastructure is ongoing, existing infrastructure is continuing to age, requiring regular maintenance, upgrade, or replacement.
Figure 5A shows the number of buildings DoE owns, and the estimated cost to replace them over the next 30 years. Approximately 14 per cent of buildings (equal to $3.7 billion) will need to be replaced in the next decade, based on the remaining useful lives the department has recorded. ‘Useful life’ is the number of years an entity expects to use an asset – not the maximum period possible for the asset to exist.
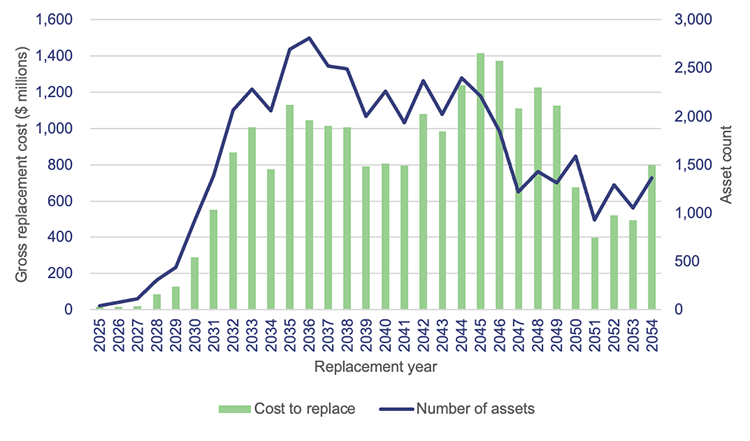
Queensland Audit Office from Department of Education asset registers 2024.
Gross replacement cost is the estimated cost to construct a similar asset, without adjustments for age and condition of the existing asset, as of 30 June each year.
Maintaining departmental assets
Education entities’ building assets must be maintained to at least a minimum level in order for them to continue to support delivery of services to meet the needs of the community.
DoE spent $568 million on maintenance in 2023–24, while DTET spent $56 million. Together, the departments increased their expenditure on repairs and maintenance in 2023–24 by $136 million (27.8 per cent).
The Queensland Government Building Policy Framework states that departments must develop and maintain a strategic maintenance plan. This plan should consider factors such as the age, functionality, maintenance requirements (both planned and unplanned), and condition of the buildings (condition assessments). Both departments have drafted their strategic maintenance plans, which their governance committees need to approve.
Over the last 5 years, both departments have adhered to Queensland Government policy by meeting their annual minimum maintenance requirements, which are one per cent of the replacement cost of their building portfolios.
Performing regular condition assessments enables the departments to have a thorough understanding of the maintenance required on their assets – including the expected timing. This should help them to achieve better value for money by grouping similar services (for example, painting several classrooms at the same time) and prioritising the order of work.
Figure 5B shows a significant increase in repairs and maintenance at DoE towards the end of each financial year. A well-planned maintenance program should generally have consistent expenditure across the year and improve the value for money.
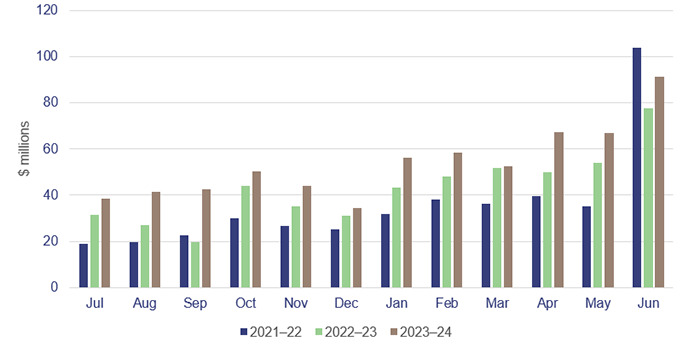
Queensland Audit Office.
Departments have made progress in assessing the condition of their assets
In Education 2023 (Report 13: 2023–24), we reported that DoE and DTET were in the process of assessing the condition of their assets to support their future maintenance plans. We had previously recommended (in our 2021 report) that both departments complete regular and timely condition assessments. In the following sections, we provide an update on the progress each department has made.
Department of Education
In last year’s report, we stated that DoE had completed its condition assessment program and was more than 60 per cent through evaluating and integrating the data from the condition assessment into its finance system.
The integration of the condition data into its finance system is now complete. DoE is working with schools to use this data to develop each school’s multi-year maintenance plan. The department expects this to be completed by December 2025.
At present, these plans only cover preventative maintenance requirements. In future, condition data will be used in the department’s asset management plans to support the efficiency and effectiveness of its future maintenance programs.
Department of Trade, Employment and Training
DTET previously used a risk-based approach to assess the condition of its buildings and infrastructure assets (TAFE campuses). This involved assessing similar components across the whole building portfolio together, rather than assessing an entire building at the same time.
It has a new condition assessment program that now involves fully inspecting and assessing all buildings and infrastructure at each campus and identifying all required maintenance works. Its program covers 41 campuses and began with a pilot condition assessment at the Acacia Ridge campus in February 2025.
By March 2025, DTET had inspected 4 of the 41 campuses – in line with its program schedule. With multiple teams working concurrently, it is planning to have the remaining campuses assessed by November 2025.
It will need to ensure the results of its inspections are documented in line with Queensland Government guidelines. The data from the condition assessments will also need to be integrated into its finance system, where it will form the basis of its multi-year maintenance plan. The department is currently developing a way to centralise the recording of condition data to inform the timing and cost of future maintenance.
6. Enabling digital learning in state schools
In Enabling digital learning (Report 1: 2021–22), we shared information about how well the Department of Education is connecting the students and staff of state schools to digital resources and online content. Since then, it has been working to increase internet speeds. This is to ensure that, regardless of geographic location, all students have the best digital learning opportunities. In Education 2022 (Report 16: 2022–23) and Education 2023 (Report 13: 2023–24), we reported on the progress made by the Department of Education in increasing internet speed in schools. In this chapter, we do so again.
In December 2021, the department signed a 5-year agreement with a supplier to upgrade internet speeds across state schools. It has significantly improved average internet speed per student since then, with almost all (99 per cent) school sites averaging speeds of 1,000 kilobits per second (kbps) or more per student.
The department began phase 2 of this project in 2024 and is expected to increase internet speeds to an average of 5,000 kbps for each student by 2026. Figure 6A shows the status of average internet speeds per region as at January 2025.

Notes: NQ – North Queensland; DDSW – Darling Downs South West; FNQ – Far North Queensland; CQ – Central Queensland; NC – North Coast; MS – Metropolitan South; SE – South East; MN – Metropolitan North.
Kbps – kilobits per second (a measure of how fast data is moving).
Queensland Audit Office from Department of Education data on internet speed in schools.
2024 education dashboard
Our interactive map of Queensland allows you to explore information on education entities and compare to other regions, including data on revenue, expenses, assets, liabilities and other measures like student and staff numbers.